chemmodlab
chemmodlab


chemmodlab contains a suite of methods for fitting machine learning
models and for validating the resulting models. The methods are tailored
to virtual screening for drug discovery applications and include
confidence bands and hypothesis tests for hit enrichment curves.
The methodologies implemented in chemmodlab are described in the following papers:
- https://jcheminf.biomedcentral.com/articles/10.1186/s13321-022-00629-0
- https://jcheminf.biomedcentral.com/articles/10.1186/s13321-018-0309-4
Installation
# install from CRAN
install.packages("chemmodlab")

# Or use the development from GitHub:
# install.packages("devtools")
devtools::install_github("jrash/chemmodlab")
Usage
Usage is divided into two sections:
- Confidence bands and hypothesis tests for hit enrichment curves
- Generalized model fitting and evaluations
1. Confidence bands and hypothesis tests for hit enrichment curves
NOTES:
- The confidence band and hypothesis test functions do not require models to be fit in chemmodlab. Only score and activity information need to be provided, and these can be provided from any model.
Confidence bands for individual curves
library(chemmodlab)

data(pparg)

HitEnrich(S.df = pparg[,c(14,2,5)],
          y = pparg[,3], labels = c("Maximum z-score","Surflex-dock", "ICM"),
          log = T, conf = T, conf.level = .95)
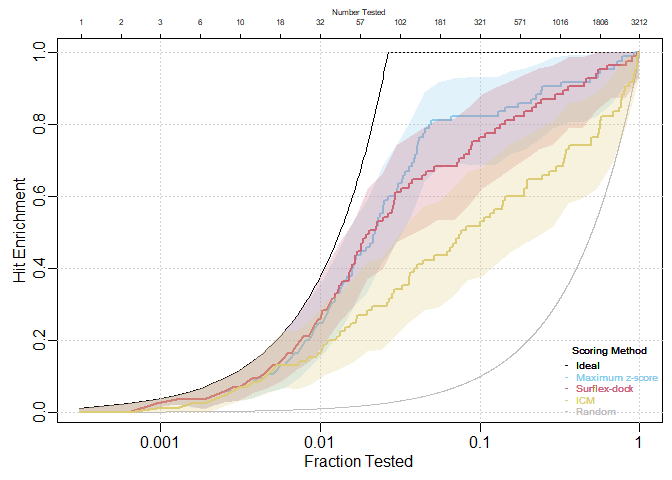
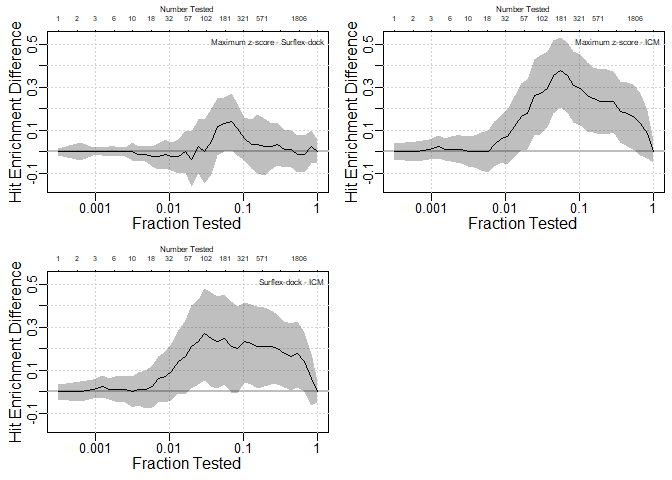
Confidence bands for differences between curves
All pairwise differences between three methods are shown:
par(mfrow = c(2, 2))

HitEnrichDiff(S.df = pparg[,c(14,2,5)], y = pparg[,3], x.max = NULL, labels =
                c("Maximum z-score","Surflex-dock", "ICM"),
              log = T, conf.level = .95)
Hypothesis tests at specific fractions
n <- nrow(pparg)
tested <- c(3,32,321)
ntested <- length(tested)
PerfCurveTest( S1=pparg$maxz_scores, S2=pparg$surf_scores,
               X=pparg$surf_actives, r=tested/n, alpha=.05)
#> $diff_estimate
#> [1]  0.00000000 -0.01176471  0.05882353
#>
#> $std_err
#> [1] 0.005366091 0.023740011 0.029532874
#>
#> $ci_interval
#>               [,1]       [,2]
#> [1,] -0.0105173443 0.01051734
#> [2,] -0.0580238186 0.03503531
#> [3,] -0.0004121052 0.11535463
#>
#> $p_value
#> [1] 1.00000000 0.62020172 0.04639319
2. Generalized model fitting and evaluations
-
ModelTrain()fits a series of classification or regression models to sets of descriptors and computes cross-validated measures of model performance. Repeated k-fold cross validation is performed with multiple, different fold assignments for the data (“splits”). -
MakeModelDefaults()makes a list containing the default parameters for all models implemented in ModelTrain. -
plot.chemmodlab()takes a chemmodlab object output by theModelTrainfunction and creates a series of accumulation curve plots for assesing model and descriptor set performance. -
Performance()can evaluate many performance measures across all splits created byModelTrain, then outputs a data frame for each D-M combination. -
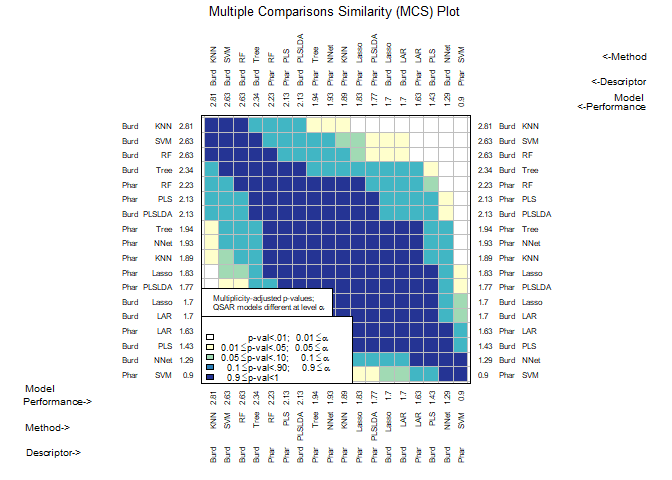
CombineSplits()evaluates a specified performance measure across all splits created byModelTrainand conducts statistical tests to determine the best performing descriptor set and model (D-M) combinations. -
chemmodlab()is the constructor for the chemmodlab object.The statistical methodologies comprise a comprehensive collection of approaches whose validity and utility have been accepted by experts in the Cheminformatics field. As promising new methodologies emerge from the statistical and data-mining communities, they will be incorporated into the laboratory. These methods are aimed at discovering quantitative structure-activity relationships (QSARs). However, the user can directly input their own choices of descriptors and responses, so the capability for comparing models is effectively unlimited.
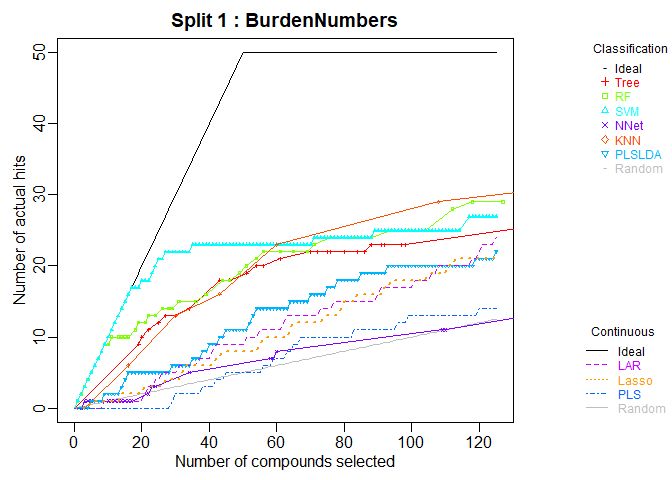
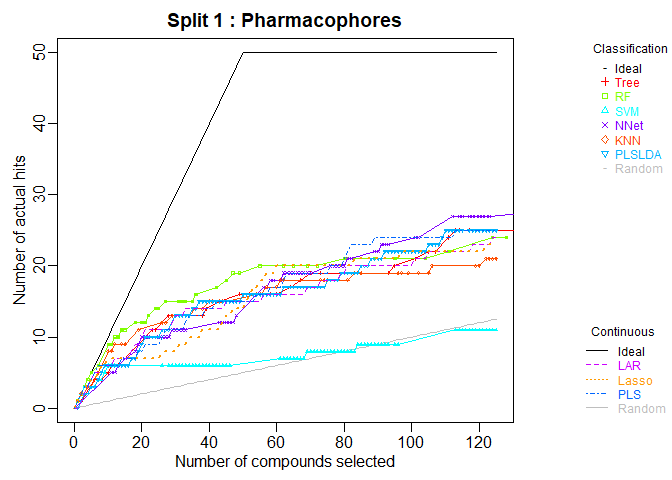
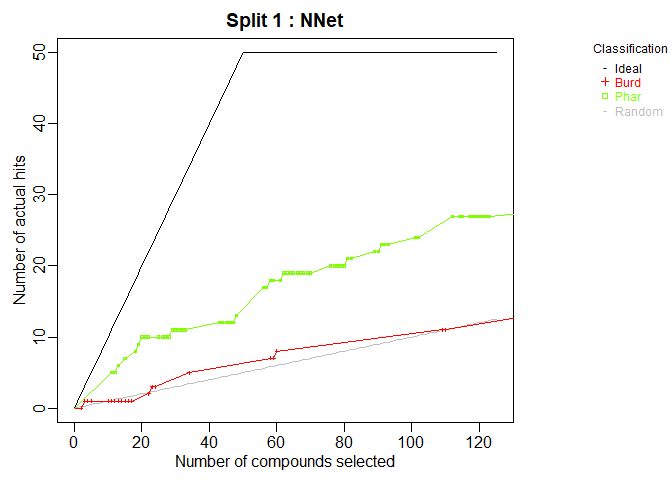
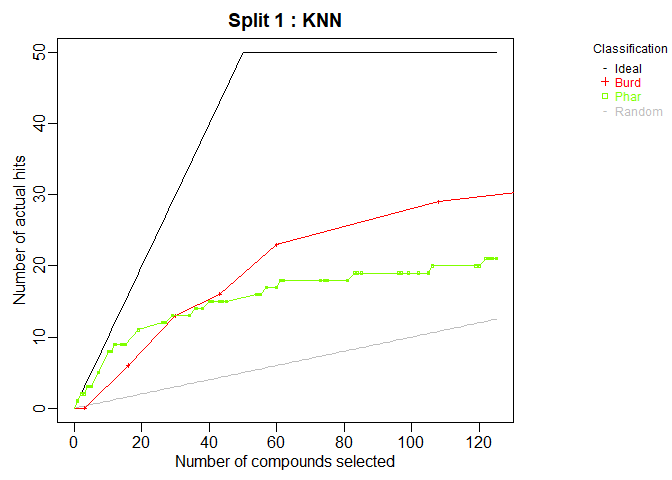
library(chemmodlab)

data(aid364)
cml <- ModelTrain(aid364, ids = TRUE, xcol.lengths = c(24, 147),
                  des.names = c("BurdenNumbers", "Pharmacophores"))
plot(cml, splits = 1, meths = c("NNet", "KNN"))
CombineSplits(cml, metric = "enhancement", m = 100)